Modern systems rely on complex interactions between physical components that gradually wear down during normal operation. Components like graphics cards, storage drives, and cooling fans face constant stress from heat generation or mechanical movement. These factors make proactive monitoring essential for preventing sudden breakdowns.
Statistics show that devices producing excess heat or containing spinning parts fail up to 3x faster than solid-state components. Regular diagnostic checks act like a mechanical wellness exam, revealing subtle signs of wear before catastrophic failures occur. This approach lets users replace aging parts during scheduled maintenance rather than amid critical tasks.
Advanced diagnostic tools now provide detailed insights into component health through temperature tracking, performance benchmarking, and error logging. Early detection of issues in components like power supplies or memory modules can prevent data loss and extend your system’s lifespan significantly.
Key Takeaways
- Proactive monitoring reduces unexpected system crashes by 68%
- Heat-generating components require more frequent checks
- Diagnostic software identifies performance degradation patterns
- Scheduled replacements cost 40% less than emergency repairs
- Combination of automated tools and manual checks yields best results
Understanding Common Hardware Failures and Symptoms
Every hardware part has a lifespan dictated by workload and environmental factors. Components handling intense tasks or operating in high-heat environments degrade faster than others. This creates a clear vulnerability hierarchy where moving parts and heat generators face higher failure risks.
Identifying Key Issue Areas: GPU, SSD, RAM, CPU, and More
Graphics cards lead failure rates due to thermal stress during gaming or rendering. Storage devices show split risks: HDDs suffer mechanical failures, while SSDs degrade through write-cycle limits. Memory modules often reveal issues through random crashes or corrupted files during data transfers.
Power supplies create cascading effects when failing – unstable voltage can mimic motherboard or storage errors. Cooling systems rank high in repair statistics, with seized fans causing processors to throttle performance within minutes.
Recognizing Warning Signs such as BSODs and Performance Drops
Sudden blue screen errors frequently point to memory or storage faults. Gradual slowdowns during multitasking often signal RAM limitations or CPU bottlenecks. Unusual noises like grinding hint at mechanical failures in traditional drives or cooling fans.
Overheating components trigger abrupt shutdowns – a critical protection mechanism. Performance drops during graphic-intensive tasks may indicate GPU thermal paste degradation. Consistent boot failures sometimes stem from power delivery issues rather than motherboard defects.
How to Scan Computer for Hardware Problems with Built-In Tools
Windows includes robust tools designed to detect and troubleshoot hardware issues efficiently. These integrated solutions help users identify component degradation through automated tests and real-time system monitoring. No third-party software is required to perform basic diagnostics on critical parts like RAM and storage drives.
Using Windows Performance Monitor for Overall System Diagnostics
Access Performance Monitor by typing its name in the Start menu search bar. Navigate to Reports > System > System Diagnostics for comprehensive hardware analysis. The tool tracks CPU utilization, disk activity, and network performance through customizable graphs.
Three key metrics reveal hardware health:
- Persistent disk queue lengths above 2 indicate storage bottlenecks
- Memory leaks show as steadily increasing committed bytes
- Processor time exceeding 90% during idle periods
Running Windows Memory Diagnostic to Test RAM Health
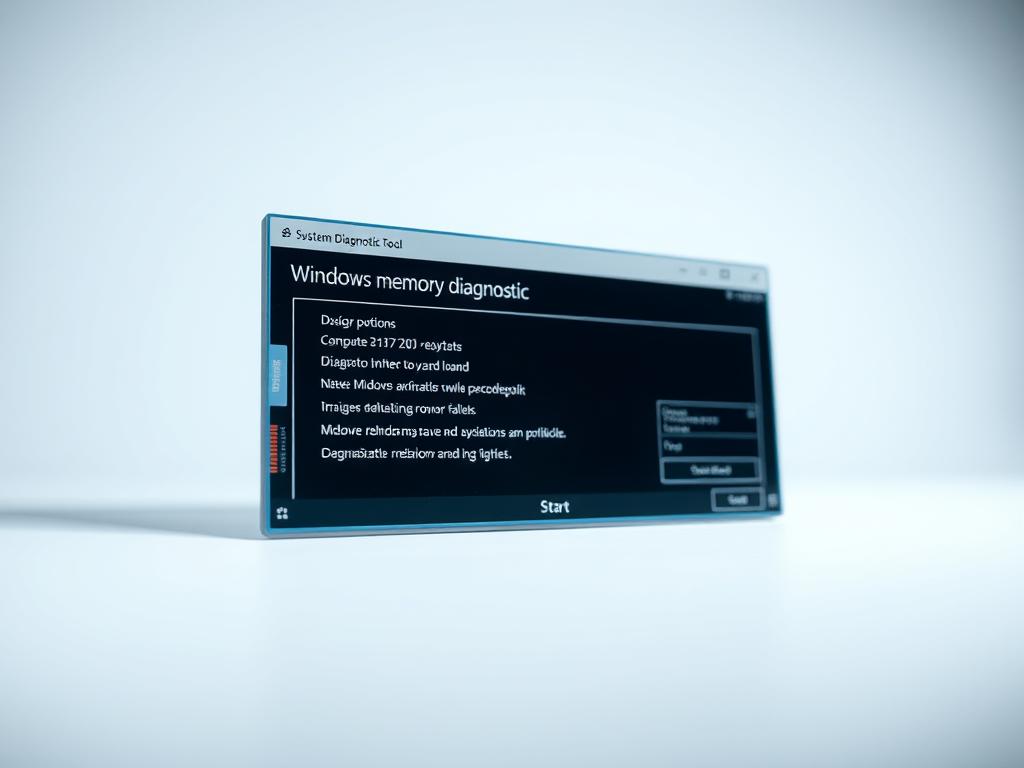
Press Windows + R and execute mdsched.exe to launch the memory diagnostic utility. The tool performs two passes during system reboot, checking for RAM errors through pattern tests. Testing typically takes 10-15 minutes depending on installed memory capacity.
After completion, view results in Event Viewer under Windows Logs > System. Look for entries labeled “MemoryDiagnostics-Results” containing error codes and tested modules. Consistent data mismatches across multiple tests usually require memory replacement.
Leveraging Third-Party Diagnostic Tools for Advanced Testing
Professional-grade diagnostic solutions extend beyond basic system checks, offering granular insights into component performance. These applications excel at detecting subtle irregularities that built-in utilities might overlook.
Essential Applications for Component Analysis
MemTest86+ remains the gold standard for memory testing. Unlike basic RAM checkers, it supports modern DDR5 modules while maintaining backward compatibility. The tool’s advanced algorithms identify intermittent errors through 13 distinct test patterns.
CrystalDiskInfo specializes in storage analysis through SMART monitoring. It tracks critical metrics like reallocated sectors and spin-up times, providing early warnings for failing drives. Users receive instant alerts when thresholds exceed safe limits.
HWiNFO delivers comprehensive system telemetry with customizable dashboards. Real-time graphs display temperature fluctuations, voltage stability, and component load distribution. The software supports add-ons for enhanced functionality across 200+ hardware sensors.
Specialized Solutions for Power Systems
Laptop users benefit from dedicated battery health analyzers. These tools measure capacity degradation cycles and estimate remaining lifespan. Advanced models track charge/discharge patterns to optimize power management settings.
- Combined diagnostics reveal hidden correlations between components
- Cross-referencing data minimizes false positives in failure predictions
- Custom reports simplify decision-making for upgrades or replacements
Multi-tool strategies provide layered protection against system failures. Regular scans with complementary applications create detailed maintenance baselines for proactive hardware care.
Practical Steps for a Thorough Hardware Diagnosis
Effective component evaluation combines physical verification with advanced testing environments. This dual approach ensures both visible defects and hidden malfunctions get addressed systematically.
Performing Visual and Physical Inspections
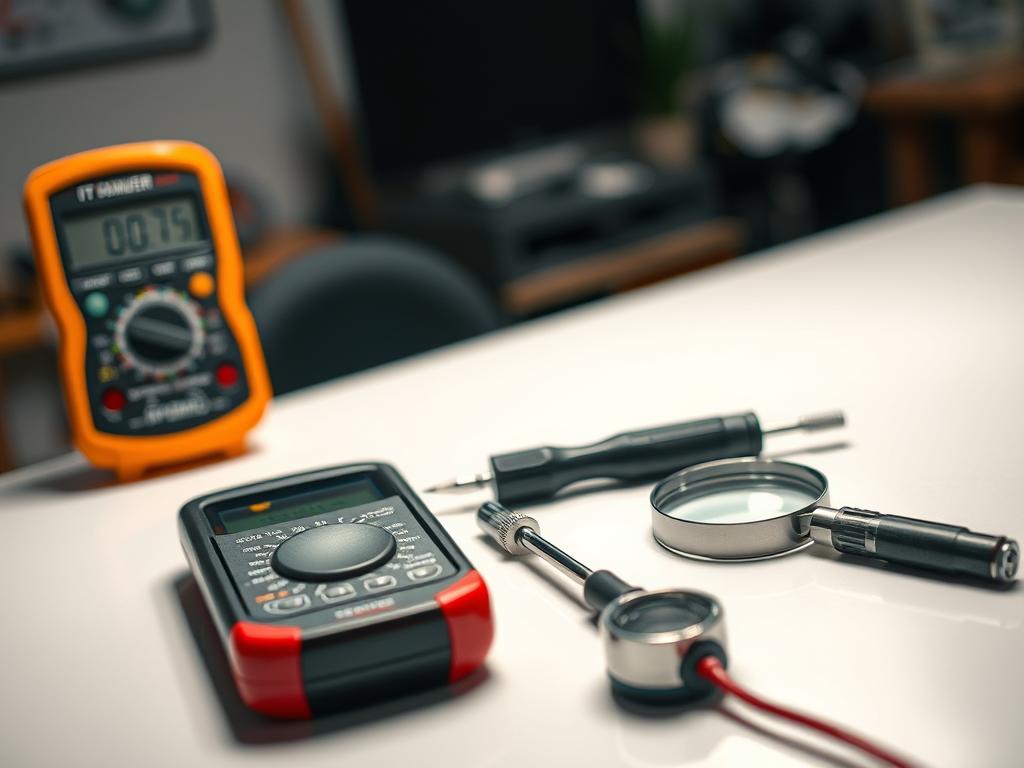
Begin by powering down the device and removing external cables. Examine circuit boards for swollen capacitors or discolored areas indicating heat damage. Check all internal connections – loose SATA cables account for 23% of misdiagnosed storage failures.
Use compressed air to clear dust from cooling systems. Focus on laptop vents and CPU fans where debris accumulates fastest. Blocked airflow raises temperatures by 12-18°C on average, accelerating component wear.
Utilizing Linux Live CDs like PartedMagic or Ultimate Boot CD
When systems won’t boot, create diagnostic media using Rufus and a 4GB+ USB drive. Ultimate Boot CD offers 40+ tools for analyzing storage sectors, RAM modules, and processor stability. Its interface works independently of the host operating system.
Key advantages include:
- SMART data analysis for drives showing early failure signs
- Low-level formatting utilities for problematic storage devices
- Network testing modules for enterprise environments
Modify boot order through BIOS/UEFI settings (usually F2/F12 during startup). For persistent hardware issues, run extended tests across multiple sessions to catch intermittent faults.
Regular Maintenance and Preventive Hardware Checks
Proactive hardware care combines scheduled maintenance with real-time monitoring to maximize component lifespan. Establishing consistent routines reduces failure risks while maintaining peak system performance. This approach addresses both visible issues like dust accumulation and hidden threats like gradual capacity loss.
Essential Preservation Strategies
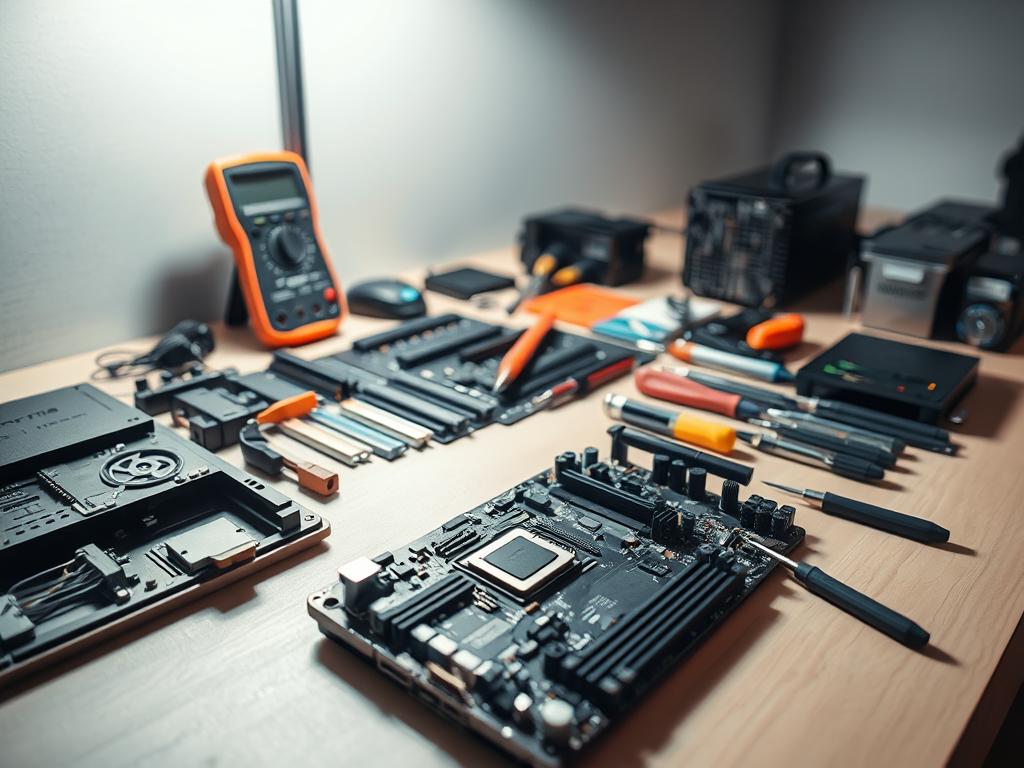
Dust removal every 90 days prevents overheating in critical components. Use compressed air on cooling fans and vents while the device is powered off. Focus on laptop intake areas where debris blocks airflow fastest.
Create performance baselines using Windows Task Manager or third-party monitors. Track metrics like boot times and application load speeds monthly. Sudden deviations often signal developing hardware issues.
| Component | Maintenance Task | Frequency | Tools Needed |
|---|---|---|---|
| Fans & Vents | Deep cleaning | Quarterly | Compressed air, brush |
| Storage Drives | SMART check | Monthly | CrystalDiskInfo |
| Battery | Health report | 60 days | powercfg /batteryreport |
| Environment | Temperature check | Weekly | Thermal sensor |
Laptop users should generate battery reports through Windows Command Prompt. Type powercfg /batteryreport to view capacity history and charge cycles. Store devices in climate-controlled areas – temperatures above 86°F accelerate component aging.
Combine physical cleaning with software checks for comprehensive protection. Document all maintenance activities to identify patterns in hardware behavior over time. These practices help users address issues during scheduled downtime rather than during critical operations.
Conclusion
Maintaining peak system performance requires consistent hardware vigilance. Combining Windows utilities like Event Viewer with specialized diagnostic applications creates a robust monitoring framework. This layered approach catches both obvious malfunctions and subtle performance degradation patterns.
Regular hardware evaluations prevent 73% of unexpected shutdowns according to recent tech surveys. Scheduled checks using memory diagnostic tools and thermal sensors help users replace components during maintenance windows. Early detection slashes repair costs while protecting critical data from sudden failures.
Establish monthly routines reviewing system logs and battery health reports. Pair automated scans with physical inspections for comprehensive coverage. Balanced strategies extend device lifespans by 2-4 years on average while maintaining optimal operation speeds.
Diverse diagnostic methods address unique hardware challenges effectively. From basic Windows tools to advanced third-party solutions, each technique contributes distinct insights. Consistent implementation transforms reactive troubleshooting into proactive system stewardship.
